 |
Direct Graphical Models
v.1.7.0
|
|
Direct Graphical Models
v.1.7.0
|
Classes | |
| class | DirectGraphicalModels::vis::CMarker |
| Marker class. More... | |
| class | DirectGraphicalModels::vis::CMarkerHistogram |
| Histogram Marker class. More... | |
Functions | |
| Mat | DirectGraphicalModels::vis::drawDictionary (const Mat &dictionary, double m=1) |
| Visualizes a sparse coding dictionary. More... | |
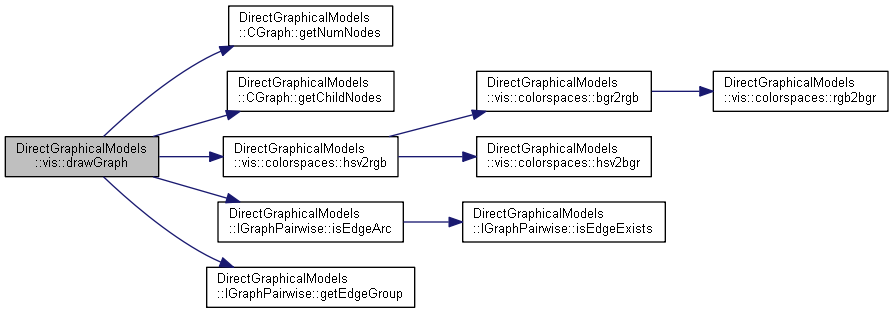
| Mat | DirectGraphicalModels::vis::drawGraph (int size, IGraphPairwise &graph, std::function< Point2f(size_t)> posFunc, std::function< cv::Scalar(size_t)> colorFunc=nullptr, const vec_scalar_t &groupsColor=vec_scalar_t()) |
| Visualizes the graph structure. More... | |
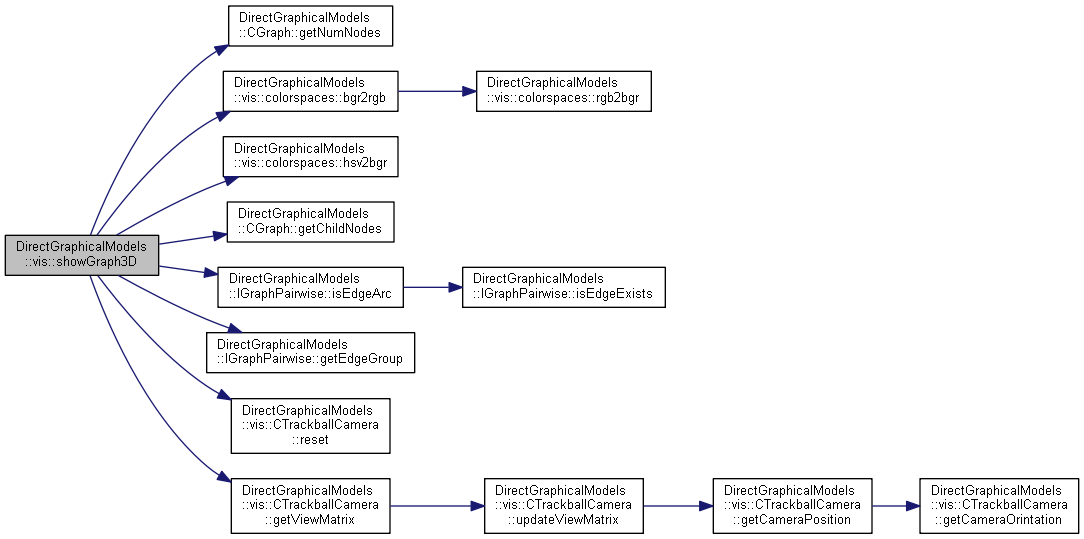
| void | DirectGraphicalModels::vis::showGraph3D (int size, IGraphPairwise &graph, std::function< Point3f(size_t)> posFunc, std::function< cv::Scalar(size_t)> colorFunc=nullptr, const vec_scalar_t &groupsColor=vec_scalar_t()) |
| Visualizes the graph structure in 3D. More... | |
Marker module provides with a variety of tools for visualizing and analyzing used data as well as intermediate and final results:
For user interaction capacity, there are more functions, which allow for handling the mouse clicks over the figures. Please see our tutorial Demo Visualization for more details.
| Mat DirectGraphicalModels::vis::drawDictionary | ( | const Mat & | dictionary, |
| double | m = 1 |
||
| ) |
Visualizes a sparse coding dictionary.
This function visualizes a dictionary, that is returned by fex::CSparseDictionary::getDictionary() fucntion
| dictionary | Dictionary: Mat of type: CV_64FC1 |
| m | The magnifier koefficients for scaling the dictionary values |
Definition at line 324 of file Marker.cpp.
| Mat DirectGraphicalModels::vis::drawGraph | ( | int | size, |
| IGraphPairwise & | graph, | ||
| std::function< Point2f(size_t)> | posFunc, | ||
| std::function< cv::Scalar(size_t)> | colorFunc = nullptr, |
||
| const vec_scalar_t & | groupsColor = vec_scalar_t() |
||
| ) |
Visualizes the graph structure.
| size | The size of resulting image |
| graph | The graph |
| posFunc | The positioning function: a mapper, that defines spacial position at the canvas for every graph node. The coordinates must lie in range [-1; 1]. For example: Point2f posFunc(size_t nodeId) { return Point2f( 0.9f * cosf(2 * n * Pif / nNodes), 0.9f * sinf(2 * n * Pif / nNodes) ); }); |
| colorFunc | The color function: a mapper, that defines color (CV_RGB(r, g, b)) for every graph node. |
| groupsColor | The list of colors for graph edge groups. |
Definition at line 76 of file MarkerGraph.cpp.
| void DirectGraphicalModels::vis::showGraph3D | ( | int | size, |
| IGraphPairwise & | graph, | ||
| std::function< Point3f(size_t)> | posFunc, | ||
| std::function< cv::Scalar(size_t)> | colorFunc = nullptr, |
||
| const vec_scalar_t & | groupsColor = vec_scalar_t() |
||
| ) |
Visualizes the graph structure in 3D.
This function creates an OpenGL window with the visualized graph, seen from a trackball camera. User may rotate, zoom, pan and centralize the visualized graph.
In order to use this function, OpenGL must be built with the USE_OPENGL flag
| size | The size of the viewing window (size x size pixels) |
| graph | The graph |
| posFunc | The positioning function: a mapper, that defines spacial position in 3D world for every graph node. For better wieving expierence, the coordinates should lie in range [-0.5; 0.5]. For example: Point3f posFunc(size_t nodeId) { return Point3f( 0.9f * cosf(2 * n * Pif / nNodes), 0.9f * sinf(2 * n * Pif / nNodes), static_cast<float>(n) / nNodes ); }); |
| colorFunc | The color function: a mapper, that defines color (CV_RGB(r, g, b)) for every graph node. |
| groupsColor | The list of colors for graph edge groups. |
Definition at line 322 of file MarkerGraph.cpp.
 1.8.14