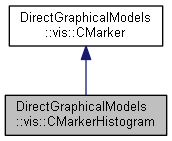
Histogram Marker class.
More...
#include <MarkerHistogram.h>
|
| static const Size | margin = cv::Size(25, 16) |
| |
| static const byte | bkgIntencity = 50 |
| |
| static const double | frgWeight = 0.75 |
| |
| static const std::string | wndName = "Feature Histogram Viewer" |
| |
Histogram Marker class.
This class allows to visualize the feature densitiy distributions (feature histograms), used in the naive bayes random model (Ref. CTrainNodeBayes).
- Author
- Sergey G. Kosov, serge.nosp@m.y.ko.nosp@m.sov@p.nosp@m.roje.nosp@m.ct-10.nosp@m..de
Definition at line 20 of file MarkerHistogram.h.
◆ CMarkerHistogram() [1/2]
Constructor with default palette.
- Parameters
-
| nodeTrainer | The node trainer. |
| palette | One of the default palletes (Ref. default_pallete). |
| vFeatureNames | Optional list of feature names. For optimal performance, each feature name should have maximal 17 symbols. |
Definition at line 30 of file MarkerHistogram.h.
◆ CMarkerHistogram() [2/2]
| DirectGraphicalModels::vis::CMarkerHistogram::CMarkerHistogram |
( |
const CTrainNode & |
nodeTrainer, |
|
|
const vec_nColor_t & |
vPalette, |
|
|
vec_string_t |
vFeatureNames = vec_string_t() |
|
) |
| |
|
inline |
Constructor with custom palette.
- Parameters
-
| nodeTrainer | Pointer to the CTrainNode class. |
| vPalette | Custom palette. It is represented as a std::vector of the custom entries of type:std::make_pair(CV_RGB(r, g, b), "class name"). |
| vFeatureNames | Optional list of feature names. For optimal performance, each feature name should have maximal 17 symbols. |
Definition at line 43 of file MarkerHistogram.h.
◆ ~CMarkerHistogram()
| virtual DirectGraphicalModels::vis::CMarkerHistogram::~CMarkerHistogram |
( |
void |
| ) |
|
|
virtualdefault |
◆ close()
| void DirectGraphicalModels::vis::CMarkerHistogram::close |
( |
void |
| ) |
const |
◆ drawClassificationMap2D()
| Mat DirectGraphicalModels::vis::CMarkerHistogram::drawClassificationMap2D |
( |
float |
Z | ) |
const |
Draws a figure with the visualization of 2-dimensional classification map.
This function calls the underlying node trainer to classify the area of 256 x 256 pixels, where every pixel (x, y) represents a 2-dimensional feature. The outcome visualization should illustrate how the underlying node trainer represents the feature distribution, which may be visualized with the drawHistogram2D() function
- Note
- Used for test purposes. Capable to visualize only 2-dimensional feature space.
- Parameters
-
- Returns
- Figure with visualized classification map.
Definition at line 14 of file MarkerHistogram.cpp.
◆ drawFeatureHistogram()
| Mat DirectGraphicalModels::vis::CMarkerHistogram::drawFeatureHistogram |
( |
word |
f, |
|
|
int |
activeState = -1 |
|
) |
| const |
|
private |
Draws a single feature histogram.
- Parameters
-
| f | Feature. |
| activeState | Desired state (class). |
- Returns
- Figure with visualized feature histogram: Mat(100, 256, CV_8UC3).
Definition at line 144 of file MarkerHistogram.cpp.
◆ drawFeatureHistogram2D()
| Mat DirectGraphicalModels::vis::CMarkerHistogram::drawFeatureHistogram2D |
( |
word |
f, |
|
|
int |
activeState = -1 |
|
) |
| const |
|
private |
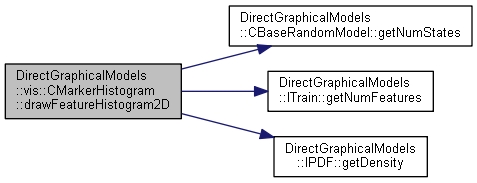
Draws a 2-dimensional feature histogram.
- Parameters
-
| f | Feature. |
| activeState | Desired state (class). |
- Returns
- Figure with visualized 2-dimensional feature histogram.
Definition at line 194 of file MarkerHistogram.cpp.
◆ drawHistogram() [1/2]
| Mat DirectGraphicalModels::vis::CMarkerHistogram::drawHistogram |
( |
void |
| ) |
const |
|
inline |
Draws a figure with the visualization of feature densitiy distributions.
- Returns
- Figure with visualized histograms of the feature distributions.
Definition at line 54 of file MarkerHistogram.h.
◆ drawHistogram() [2/2]
| Mat DirectGraphicalModels::vis::CMarkerHistogram::drawHistogram |
( |
Scalar |
color | ) |
const |
|
private |
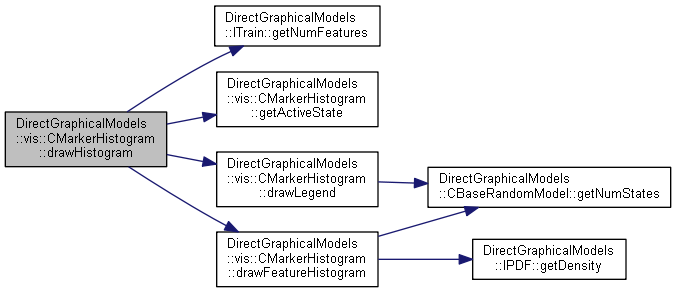
Draws the figure with a visualization of feature densitiy distributions.
This function also allows for active user interaction: after the figure is drawn, user may click upon it, and the color of the clicked point is than transmitted to the fuction as argument. The function will redraw the fugure, depending on the input color.
- Parameters
-
| color | Color of a pixel from the resulting histogram. This optional parameter is used for active user interaction. |
- Returns
- Figure with visualized histograms of the feature distributions.
Definition at line 88 of file MarkerHistogram.cpp.
◆ drawHistogram2D() [1/2]
| Mat DirectGraphicalModels::vis::CMarkerHistogram::drawHistogram2D |
( |
void |
| ) |
const |
|
inline |
Draws a figure with the visualization of 2-dimensional node potentials histogram.
- Note
- Used for test purposes. Capable to visualize only 2-dimensional feature space.
- Returns
- Figure with visualized histogram.
Definition at line 60 of file MarkerHistogram.h.
◆ drawHistogram2D() [2/2]
| Mat DirectGraphicalModels::vis::CMarkerHistogram::drawHistogram2D |
( |
Scalar |
color | ) |
const |
|
private |
Draws the figure with the visualization of 2-dimensional node potentials histogram.
- Note
- Used for test purposes. Capable to visualize only 2-dimensional feature space.
- Parameters
-
| color | Color of a pixel from the resulting histogram. This optional parameter is used for active user interaction. |
- Returns
- Figure with visualized classification map.
Definition at line 128 of file MarkerHistogram.cpp.
◆ drawLegend()
| Mat DirectGraphicalModels::vis::CMarkerHistogram::drawLegend |
( |
int |
maxHeight, |
|
|
int |
activeState = -1 |
|
) |
| const |
|
private |
Draws a legend to the main figure.
- Parameters
-
| maxHeight | The maximal height of the legend figure. |
| activeState | Desired state (class). |
- Returns
- Figure with visualized legend to the main figure.
Definition at line 244 of file MarkerHistogram.cpp.
◆ getActiveState()
| int DirectGraphicalModels::vis::CMarkerHistogram::getActiveState |
( |
Scalar |
color | ) |
const |
|
private |
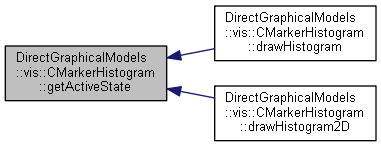
Retrieves a chosen by an user state, from the color.
- Parameters
-
| color | Color of a pixel from the histogram figure. |
- Returns
- Active state (class) if color matches the palette, -1 othervise.
Definition at line 134 of file MarkerHistogram.cpp.
◆ showHistogram()
| void DirectGraphicalModels::vis::CMarkerHistogram::showHistogram |
( |
void |
| ) |
|
Visualizes the feature densitiy distributions in a separate window with user interaction.
This function creates an OpenCV window with the visualized histograms. Click on the color box for specific state (class) visualuzation.
Definition at line 66 of file MarkerHistogram.cpp.
◆ bkgIntencity
| const byte DirectGraphicalModels::vis::CMarkerHistogram::bkgIntencity = 50 |
|
staticprivate |
◆ frgWeight
| const double DirectGraphicalModels::vis::CMarkerHistogram::frgWeight = 0.75 |
|
staticprivate |
◆ m_nodeTrainer
| const CTrainNode& DirectGraphicalModels::vis::CMarkerHistogram::m_nodeTrainer |
|
protected |
◆ m_vFeatureNames
| vec_string_t DirectGraphicalModels::vis::CMarkerHistogram::m_vFeatureNames |
|
private |
◆ margin
| const cv::Size DirectGraphicalModels::vis::CMarkerHistogram::margin = cv::Size(25, 16) |
|
staticprivate |
◆ wndName
| const std::string DirectGraphicalModels::vis::CMarkerHistogram::wndName = "Feature Histogram Viewer" |
|
staticprivate |
The documentation for this class was generated from the following files:


 Public Member Functions inherited from DirectGraphicalModels::vis::CMarker
 Protected Attributes inherited from DirectGraphicalModels::vis::CMarker


